

Understand Candlesticks
“So those box things with lines. What’s going on there?”
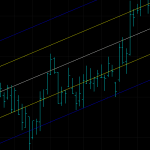
Welcome to crypto chart reading 101. Understanding candlesticks. You see them everywhere, but let’s break down what they really mean.
History
Candlestick charts date back to 17th century Japanese rice traders. They needed a way to track rice contracts. It eventually evolved to being used in a futures market where ‘coupons’ were issued promising the delivery of rice at a future time. This was the beginning of futures trading.
A Japanese rice trader Homma Munehisa was known as one of the first to use technical analysis and candlesticks to predict prices and trade contracts.
He discovered that although there was a link between the supply and demand of rice, the markets were also strongly influenced by the emotions of the traders. Because of this, there were times when the market perceived a harvest as different from the actual.
This is no different than the stock market and crypto market we have today.
Elements of a Candlestick
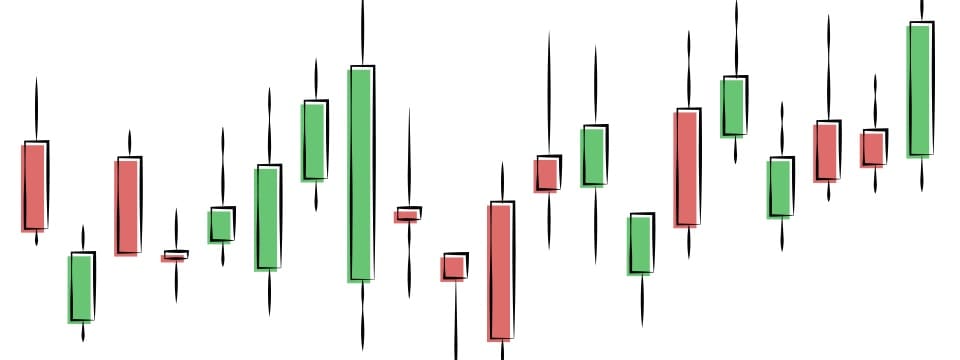
In theory, the structure of a candlestick is very simple. You have the the size of the body, the color of the body, and the sticks sometimes on top and bottom of the body.
Let’s start with just the color of the body.
Green means that the closing price in the given time period was higher than the opening price. So if the time period for one candle stick on a chart was 4 hours and the body was green, that means the value of the stock or commodity closed the 4 hour window at a higher price point. Similarly, if the body is red, the stock closed at a lower price than it opened at.
The length of the sticks that often extend beyond the body shows the full trading price fluctuation during that time period. If our candlestick opened at $100 dollars and closed at $103 we might see a high during the set time period of $104 though. This shows that there was at least one trade completed at that price point.
No matter the time period, we are only using candlesticks to determine open/close prices and high/low prices. You can’t determine anything with just one candle stick. But when combining enough of these candlesticks over a longer period of time we can see trends and make estimations on future market prices.
This is just the first step to understanding and reading charts.
