What Is A Moving Average?
One of the most popular technical indicators is moving averages. This is used to gauge the current market trend. Moving average is calculated by averaging a number of past data points.
SMA or simple moving average is a calculation based on data.If we are looking at calculating a basic 10 day moving average we would add up the closing prices from the last ten days and then divide that number by ten.
This is classified as a moving average because as new values became available you replace the old ones. For example, if we are calculating the simple moving average from February 1st thru the 10th once we hit closing day on the 11th we would then calculate the SMA from the 2nd thru the 11th.
What Do Moving Averages Look Like?
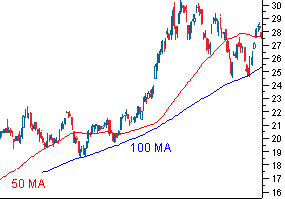
Once you have calculated the moving averages then they are planted on a chart and connected to create a moving average line. You may have noticed these curvy lines on the charts of traders. In the example below the red line is average price over the past 50 days and the blue line is the average price over the last 100 days.

Now that you have a little better understanding of SMA we will look at Exponential moving average (EMA).
Exponential Moving Average
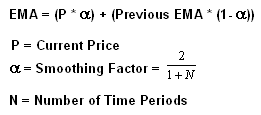
EMA gives more weight to the recent prices to try and make decisions that are more responsive to the new information. EMA is a little more difficult to calculate and most trading softwares will calculate it for you. Below if you are curious is the actual equation.

For the “previous EMA” you will take the simple moving average and utilize that formula.
So What Is The Difference Between the EMA and SMA
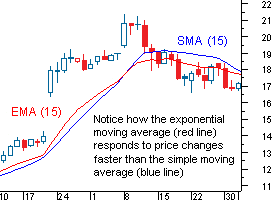
Now we should understand how EMA and SMA are calculated but lets look at the differences. EMA looks at the more recent data points so it is classified as a weighted average. EMA responds more quickly to changing prices. This is why many traders prefer EMA over SMA. Below you will see how EMA has a higher value when the prices are rising and then falls faster than the SMA when the price is declining.

The most common time frames for people who use moving averages are 15,20,30,50,100 and 200 days. The smaller span of time is more sensitive to price changes. The longer the time span the less sensitive and more smoothed out the average will be.
The best way to figure out what time frame is better is to use one that fits your strategy which will take testing.
The best way to figure out which one works best for you is to experiment with a number of different time periods until you find one that fits your strategy. Later in the week we will tackle more on moving averages. Stay tuned!
-AboveCrypto Team


