

Part 2: Not Understanding Basic Fundamentals
Most people who trade think charts and technical analysis is extremely complicated or over-rated. The fact of the matter is that market movements and coin prices can be used to increase your chances of successful trades.
As with everything in life especially related to markets there are no guarantees especially in the crypto market. It is extremely volatile and emotionally driven.
If you are investing you should at the very least understand candlesticks, support and resistance lines & trend lines.
We will not cover technical analysis in these posts but if you are interested in that piece you can check out all of our other blog posts or our premium member section.
At the very least you need to understand resistance zones. These are price ranges where a coin has failed to break through while support zones are where the price bounces back. The more you understand these the better you can identify where prices stand and if they will go up or down.
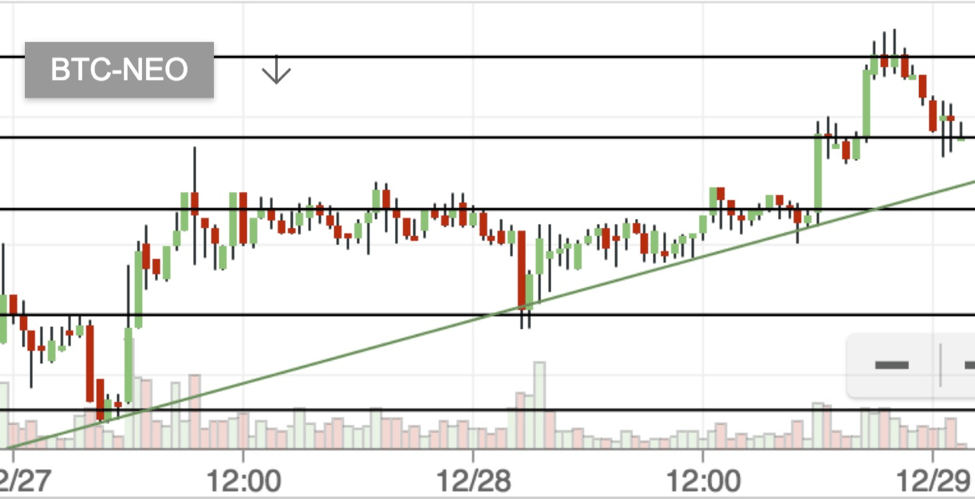
Trend lines are not extremely difficult Uptrend is indicated by the price making higher lows and downtrend is reflected by lower lows. Below you will see in the screenshot these concepts. The horizontal lines mark where prices find a ceiling or a floor and is typically in an uptrend. The past resistance zones can become supports down the road. You will notice how the candles failed to breach the second horizontal line and then later bounce of the same line in a downtrend. This is an example of a support line becoming resistance.

Stay tuned for part 3.
-AboveCrypto Team


