

Types Of Charts
There are three different types of charts that are most commonly used.
- Bar Chart
- Line Chart
- Candlestick Chart
Bar Chart
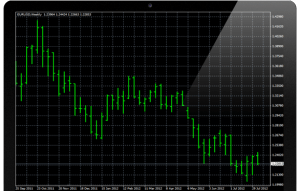
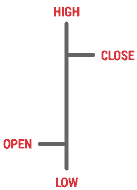
A bar chart is compiled of vertical bars. The bars show the open, close, low and high of the prices. Each bar indicates a time period with the top of that bar being highest price during that time frame and the lowest part of that bar being the lowest price during that time frame. The left tic is the opening price and the right tic is the closing price during that time.
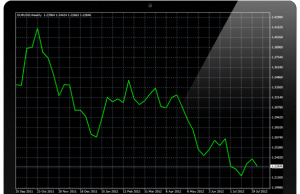
Line Chart
This type of chart connects all the closing prices to show the movement.
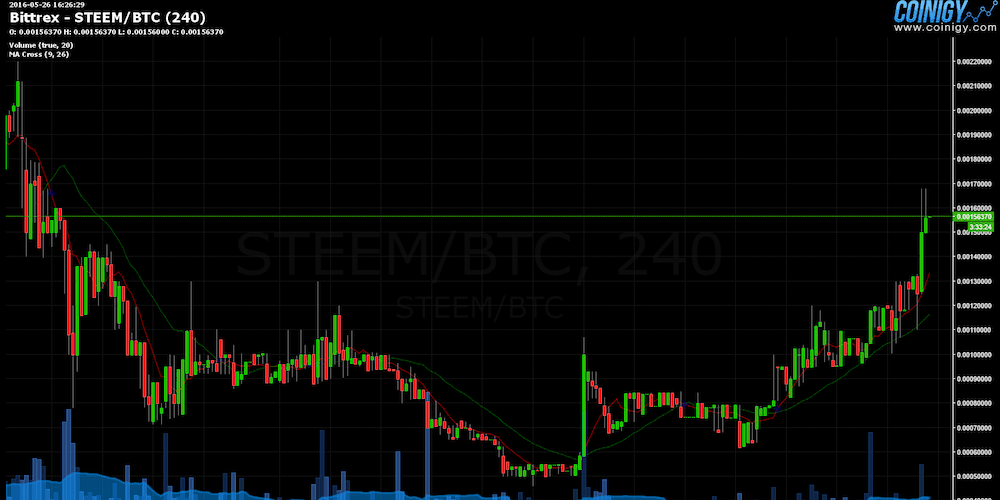
Candlestick Chart
This type of chart is the most widely used amongst traders. This allows you to see the highs and lows of the prices but is also easier to utilize technical analysis. This is the difference between a candlestick chart and a bar chart.
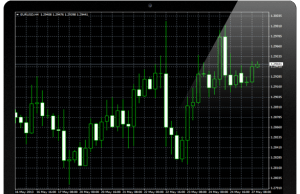
It is easier to see the swing high and the swing lows as well as reversals from an uptrend and a reversal from a downtrend.
The parts of the candle
The body is identified below. The top of the body is the open and the bottom part of the body is the close. Off the top and bottom of the body you will notice a wick or also called a shadow. These show the highs and lows during that time.
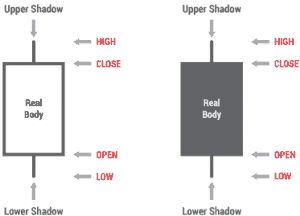
If the candle is white then this means the closing price was higher than the opening price and a black candle means the opposite. THe closing price was lower than the the opening price. Other colors are also used such as green and red.
Stay tuned for more!
-AboveCrypto Team

